
UDO Debugger - Easiest way to work and QA Tealium implementations
Some years ago, I published my "Tealium Debugger" extension for Chrome which after a nice email my Inbox got, ended being named "UDO Debugger" ( no hard feelings at all ).
You may click no the next CTA if you want to install the extension in your browser =)
That version published circa Apr 2017, was just showing up the current app state on the page loads, the current account, profile, and environment details. There was no support for anything else. Sadly I switched works and I was not able to work with Tealium anymore, despite my requests to get some testing account access to improve the extension.
The good news is that I'm back on some works with Tealium which means it's a nice time to update the extension. I'm pleased to say that after a lot of hours of works, I've completely refactored the extension, and I've added lots of cool features that I hope makes the analysts and developers in the need to work with Tealium a bit more easier :)
Let me put a small list of the current features on the debugger:
- Tealium Presence Detection and profile, account, environment reporting.
- NEW. App State, Utag.link, utag.view Reporting
- NEW. The current fired tags are reported.
- NEW. Clipboard Support.
- NEW. Environments Switcher
- NEW. Debug Enabler / Reporter
Tealium Presence Detection
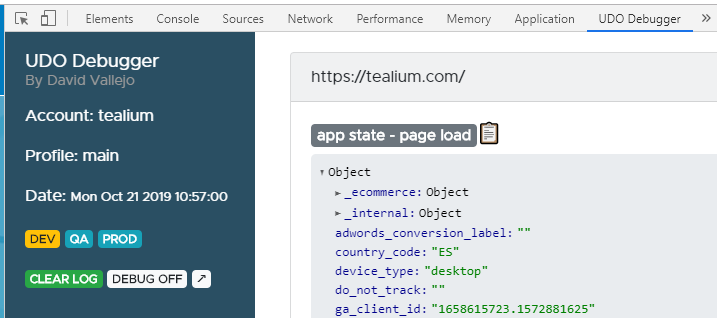
The extension will automatically report to you if Tealium has been loaded on the current page.
Along with this info, you'll be able to see the current enabled environment, profile and account name. Also, you will be able to see the current version loaded ( useful for easily seeing when the last publication is live ).
App State, Utag.link, utag.view Reporting
In the previous versions, only the App State was being reported. ( when I refer to app state it's the original utag_data value.
On the new version, all the UDO model is shown on the page load, and for making the debugging easier all the data layer keys that are internal to Tealium. As you may know, Tealium collects some details by default data that can be used, for cookies, meta tags, audienceStream audiences, queryString parameters, etc ), are grouped into the _internal key, also we're doing the same for the keys that are related to the eCommerce.
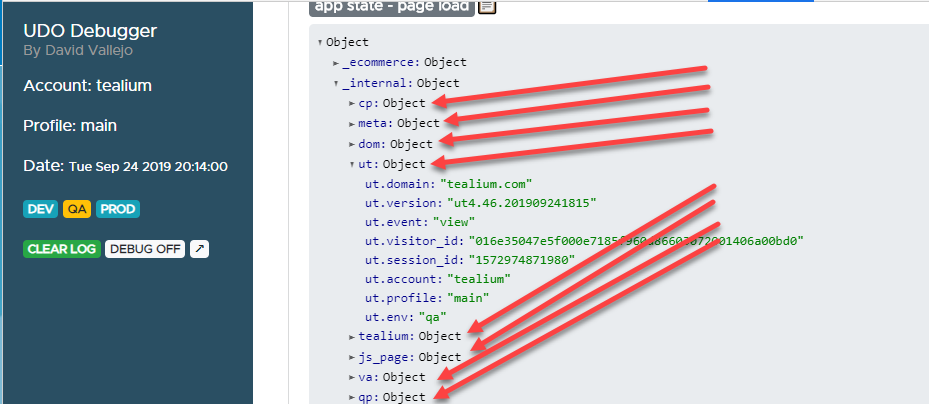
This way you could just focus on the Universal Data Object keys that are really up to you.
And yes now the UTAG.LINK and UTAG.VIEW calls are being reported. So each time your site does a call you'll be notified.
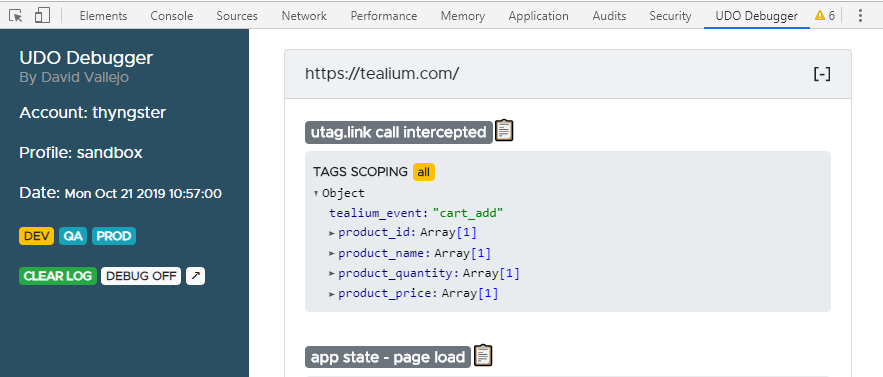
And the coolest thing is that you'll be able to see if the current link/view was scoped for a certain tag or if they were pushed along with any callback, even being able to see a fully prettified and formated output of the callback code.
The current fired tags are reported
This new UDO Debugger version can to show you the current tags being fired by the site via Tealium. And they will appear in the report automatically as they fire :).
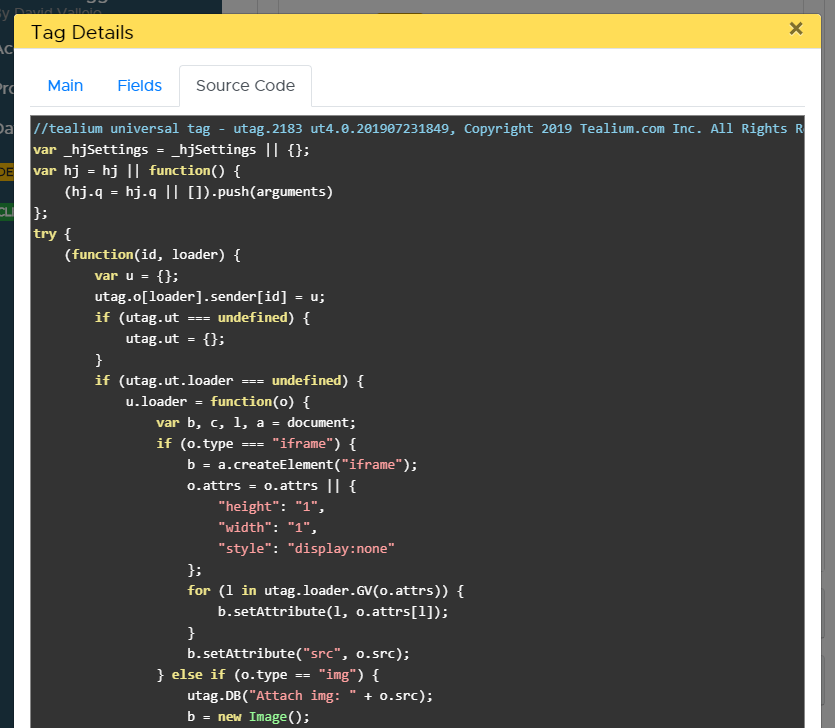
And ... did you ever meet any implementation where the tag names were named so badly, something like "marketing pixel" , or even not matching the current pixel, like firing a Google Ads Pixel and having a name like "Conversion Pixel FB" ?, I'm sure you did. Now on UDO Debugger, you'll be able to click on the tags ID's and you'll get a full report on what that pixel is. Like the real template name, the description, the available configurable fields for that pixel on Tealium and ... you will be able to see the current tag code, in a prettified and formated way without needing to go to Tealium and editing the template! ( say yay! )
Clipboard Support
Any app state/utag.link/utag.view is eligible to be copied into your clipboard with a mouse click. And they will be copied on a nicely formatted way, easy to report to your IT department or for writing your documentation :)
Environments Switcher
Within the main window of the extension, you'll be able to switch to DEV / QA / PROD environments. This setting while last while the browser session is open.
If you ever worked with the native solution to switch environments on Tealium it has 2 big issues in my opinion:
- utag.sync is not affected. So it will not be redirected.
- If you use the switching cookie, instead of doing a redirect, it will load a second utag.js on top of the first one, ending on some odd behavior under certain circumstances. For example, let's say that your "prod" environment has an extension that sets a global variable window.thyngster, then you say let's load our "dev" environment where that variable is not set. You may see that variable being set despite you're not expecting it, making you go crazy!
We're have solved this 2 issues, the newly added environment switcher added to UDO Debugger will perform 307 redirects for both utag.js and utag.sync.js files requests so you can be able to do some proper QA and testing.
Debug Enabler / Reporter
As I'm sure you already know you can have Tealium pushing all the debug logs to the console ( via the calls to utag.DB in the templates ). For getting this done, you'll only need to create a cookie named 'utagdb' with a true value this way:
document.cookie="utagdb=true";Still, a lot of stuff is pushed to the console, which makes difficult to follow what going on, since it'll be messed with other messages, request failed or scripts errors.
This version allows you to enable the debug switch just from the interface, and it will then show you in a nice table. you'll even be able to check previous pages logs. Which will make the utag.debug diggest a lot easier.