Step-by-Step Guide: Measuring JavaScript Memory Usage on Your Web Pages
Anyone that knows me is aware of how obsessive may I be when working on something from the optimization perspective. I really mi
The point of this post is measuring the current memory usage by the JavaScript in our pages, for this we'll be using the performance.memory API . I have to start saying it's a currently deprecated feature that it's only available on Chromium browsers, which returns the JavaScript heap details, and that it may miss some accuracy depending on if some pages sahre the same heap or the page has iframes using a separate heaps.
A new experimental API is meant to replace this one, Performance.measureUserAgentSpecificMemory(), which will be able to estimate the current web page memory usage including it's iframes and related workers. But it needsf or cross-origin-isolation ( window.crossOriginIsolated ), and we'd need to add teh COOP/COEP headers to our site. So let's work with the old API for now.
In any case, we'll be working with the current performance.memory API, which may end giving us some good tips on our current pages memory usage.
Let's get on it
performance.memory
As we mentioned before this is a function, that will return the current JS Heap of the current page and will only work for Chromium based browsers, still having a sampling of this metric could help us on measuring how our sites performs,
It will return 3 different metrics.
jsHeapSizeLimit , The max. memory available for the current context.totalJSHeapSize , The total allocated head size.usedJSHeapSize , The current active segment of JS Heap 
In any case returning the current memory usage at an specific moment doesn't give much value, so I prepared an script that will recording the current values during the page load, and that pushes the maximum, minumun, and average memory usage to our dataLayer.
You can personalize the values, by default the script will ask for the current memory usage each 1/4 seconds ( 250ms ), during 10 seconds, or 2.5seconds after the page load event whatever comes first. Just in case the data will be pushed if the user navigates away from the page before any of the previous rules happen using the beforeunload page event.
You can personalize these values on the script top section. Please have in mind that using a 1 millisecond polling time won't be likely giving you better insights, just keep that value
The idea is grabbing the memory usage during the page rendering, since after the page load it may not change much. ( this will depend of course, if you have some lazy loading content, the memory usage will keep changing ), or you may be using an SPA site, that you may want to monitor on some regular intervals, if that case you may have this running on the background and push the momory usage data for each history.change or virtual pageview
The code Snippet
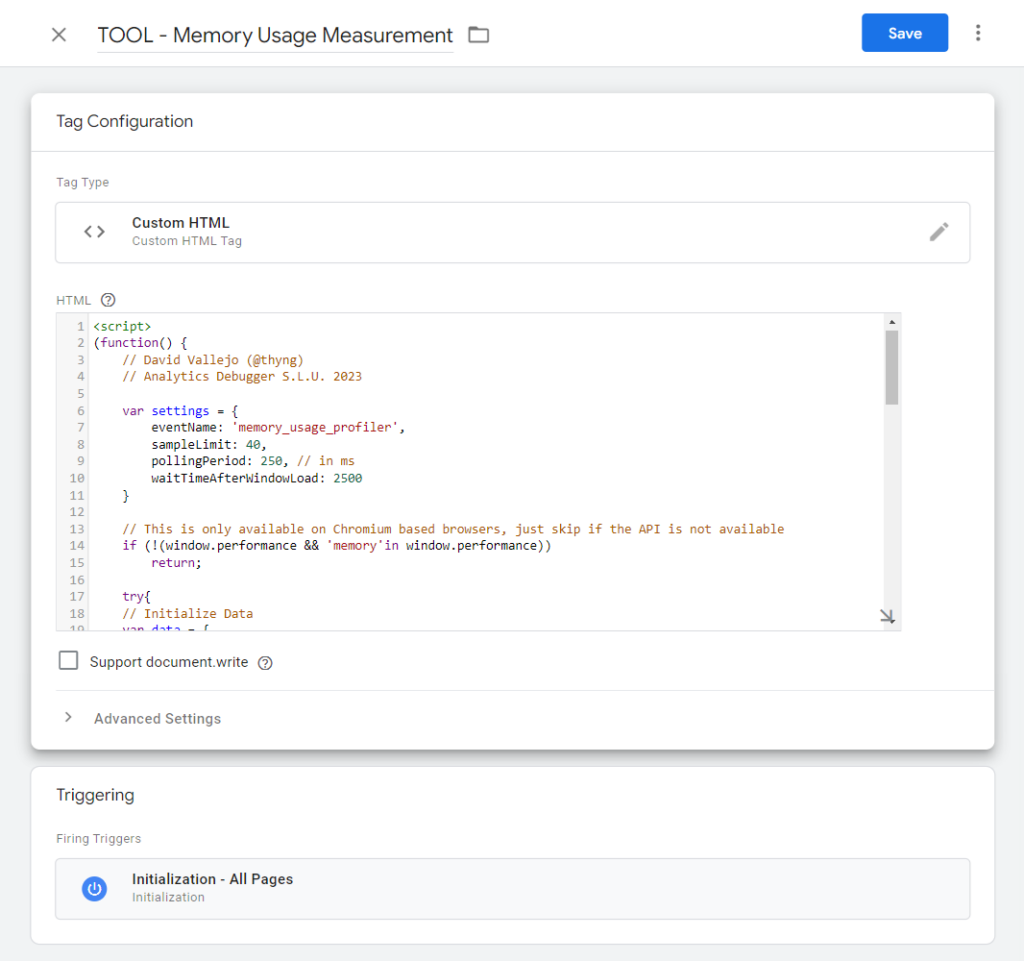
Here you can find the code that will take care of monitoring the memory usage over the page load. Please the sooner you add this code into the page the better, if you are using Google Tag Manager using the gtm.init , gtm.js / All Pages events, if you have a TMS with the option of adding sychrounous code that's your best choice, and lastly adding directly into the page.
| Parameter | Description |
| eventName | The event name to be using on the dataLayer Push . string |
| sampleLimit | Total count of samples to take. integer |
| pollingPeriord | Polling time in ms . This along with the sampleLimit will defined how much max time will take the vent to fire. integer |
| waitTimeAfterWindowLoad | Total Seconds to wait after windows load. It doesn't make many sense waiting 10 seconds if the page loads comes in 2 seconds, So we're pushing the data on this data without waiting for all the sample limit. integer |
<script>
(function() {
    // David Vallejo (@thyng)
    // Analytics Debugger S.L.U. 2023

    var settings = {
        eventName: 'memory_usage_profiler',
        sampleLimit: 40,
        pollingPeriod: 250, // in ms
        waitTimeAfterWindowLoad: 2500
    }

    // This is only available on Chromium based browsers, just skip if the API is not available
    if (!(window.performance && 'memory'in window.performance))
        return;

    try{
    // Initialize Data
    var data = {
        sent: false,
        samplesCount: 0,
        max: performance.memory.usedJSHeapSize,
        min: performance.memory.usedJSHeapSize,
        avg: performance.memory.usedJSHeapSize
    }
    var pushData = function(data) {
        if (!data.sent) {
            window.dataLayer.push({
                'event': settings.eventName || 'memory_usage_profiler',
                'event_data': {
                    'max_memory_usage': (data.max / 1024 / 1024).toFixed(2),
                    'min_memory_usage': (data.min / 1024 / 1024).toFixed(2),
                    'avg_memory_usage': (data.avg / 1024 / 1024).toFixed(2),
                }
            })
            data.sent = !!true
        }
    }

    var clear = setInterval(function() {
        if (performance.memory.usedJSHeapSize > data.max)
            data.max = data.avg
        if (performance.memory.usedJSHeapSize < data.min)
            data.min = data.avg
        data.avg = (data.avg + (performance.memory.usedJSHeapSize)) / 2
        data.samplesCount++;
        if (data.samplesCount >= settings.sampleLimit) {
            clearInterval(clear)
            pushData(data)
        }
        ;
    }, settings.pollingPeriod)

    // If page has been already loaded, wait 1 second and push the data
    window.addEventListener("load", function(event) {
        setTimeout(function() {
            clearInterval(clear)
            pushData(data)
        }, settings.waitTimeAfterWindowLoad);
    }
    );
    // In case the user navigates away from the page...
    // Should prefer to use hide,load mechanism, Pending.
    window.addEventListener('beforeunload', function(event) {
        clearInterval(clear)
        pushData(data)
    });

    }catch(e){}
}
)()
</script>
Sending the data
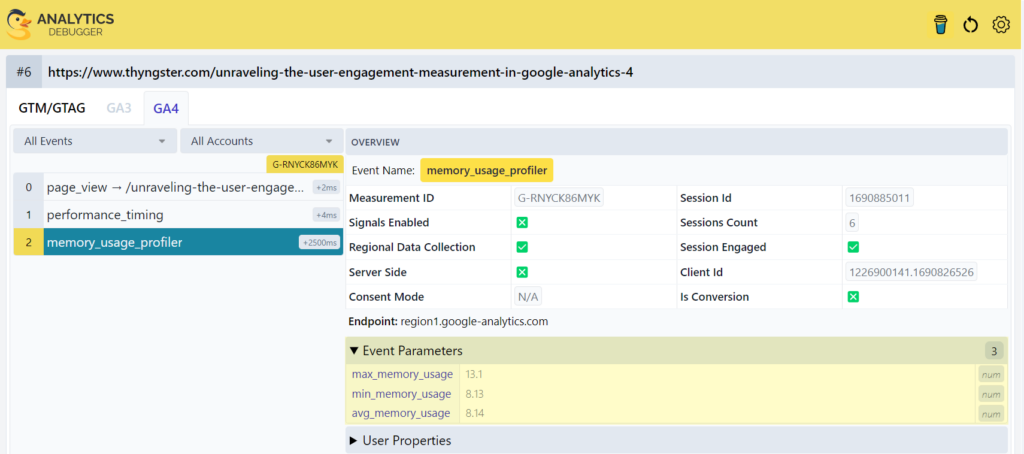
At this point we have all the data coming into our dataLayer, this means that we could send it to wherever we want to. As usual I'm using Google Analytics 4 , and then make use of some Metrics for getting the averages.
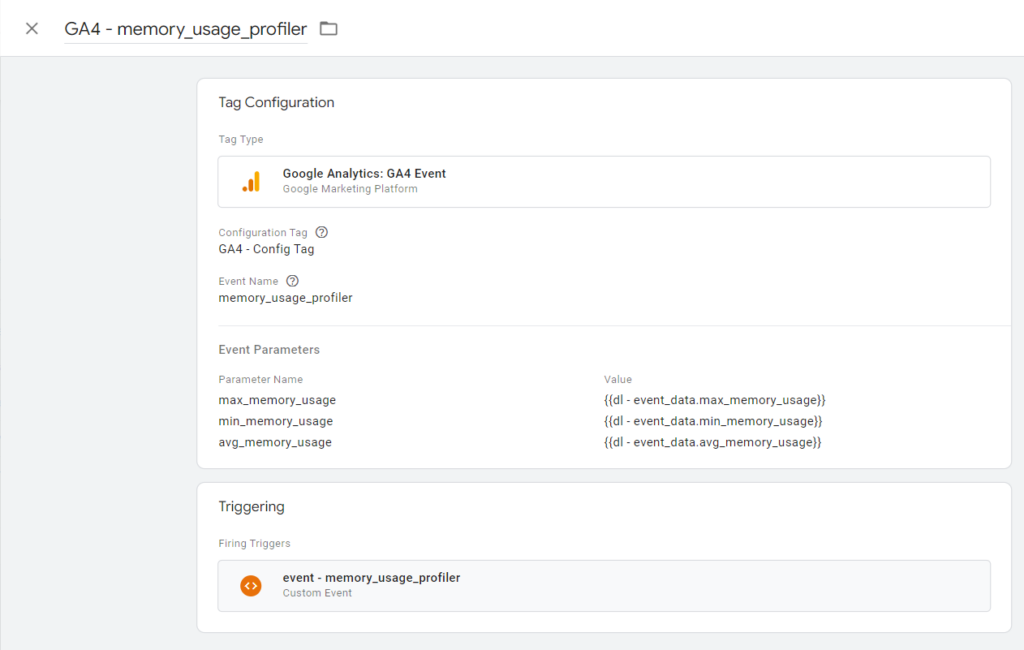
It's gonna be some easy setup, just create 3 dataLayer type variables, a trigger to match the event name you defined for this tracking ( default: "memory_usage_profiler" ) , and lastly map all to a GA4 event Tag.
Google Analytics 4 Metrics
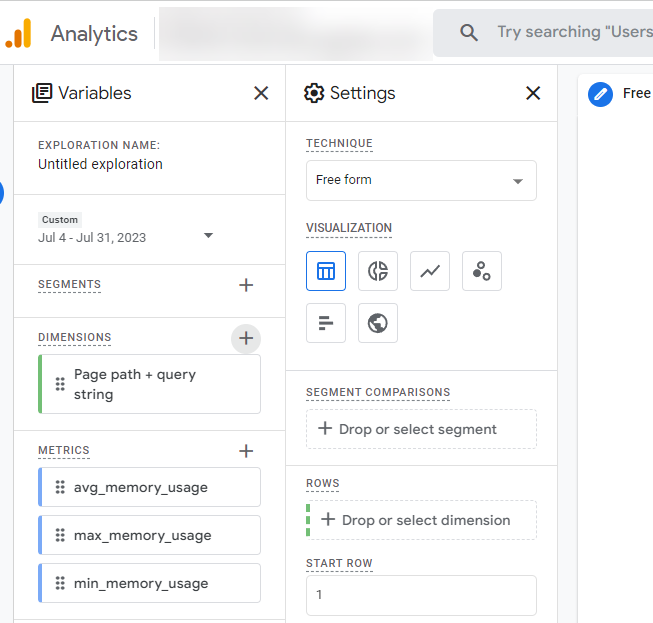
We'd need to create some metrics in our account, we should create metrics and not dimensions.

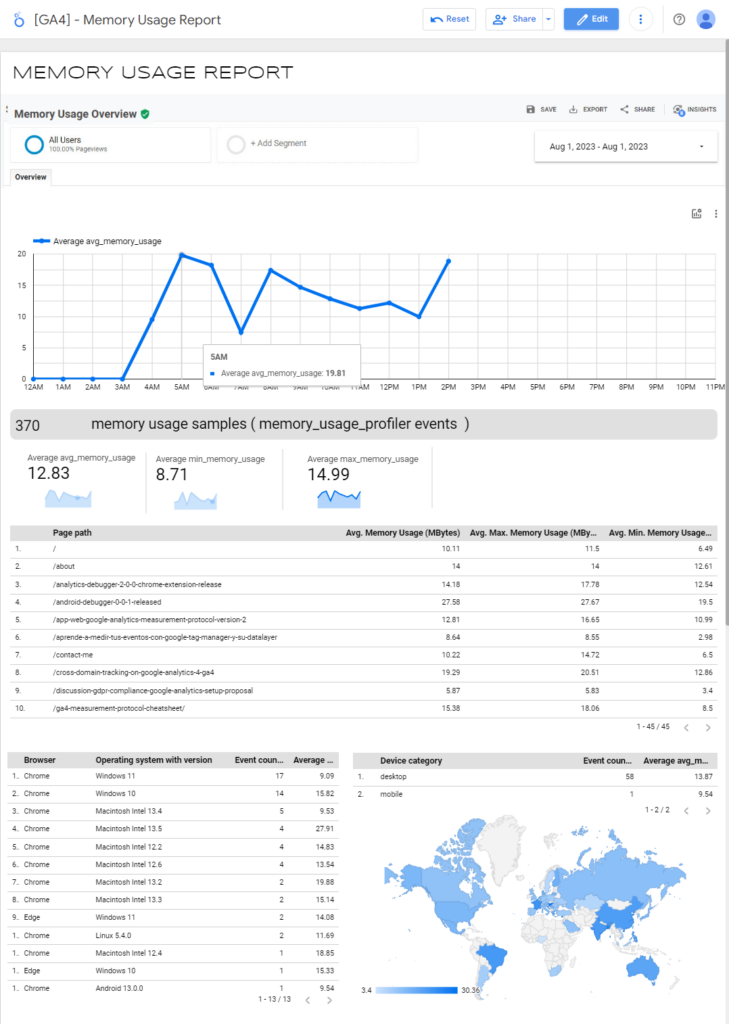
Looker Studio Report Example
I quickly built a looker studio report to show how the data will look like.
