[Release] iOS/Android Debugger 1.0.0
It's been half a year since I released my Android Debugger during the Super Week Punchcard Prize contest. Today it's a big day for the family, and most logic next step on this travel, I'm adding support for iOS devices.
This tool is offered "as is" and for free. While you won't have to pay for it, you'll be getting some nag screens to invite you to support the development, either grabbing me a coffee or even better becoming a monthly sponsor (?).
DOWNLOAD iOS ANDROID DEBUGGER 1.0.0
Android
The Android version supports debugging your Firebase ( GA4 ), Universal Analytics ( GA3 ) and Google Tag Manager ( basic data ) implementations out of the box for any app on your device. There's no need for modifying the manifest file, there's no need to install any certificates, it just works.
It supports USB and Wireless debugging sessions ( meaning that you won't need to mess around with the USB Drivers or anything else )
iOS
The iOS version works in a totally different way and it uses a proxy to intercept the requests being sent by the device.
It currently supports debugging features for Firebase( GA4 ), Universal Analytics ( GA3 ) and Adobe Analytics ( sorry this is not currently available for Android )
Features
Firebase ( GA4 )
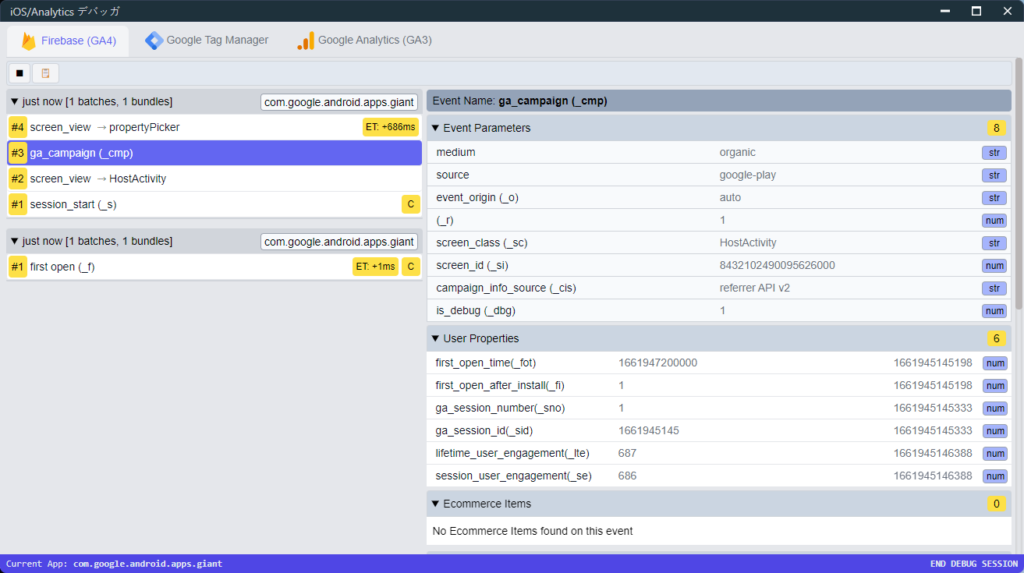
You'll be able to see the current events being sent by your app in a very nicely and intuitive way. It event reports the current batches, if hits contains e-commerce details, if the current event is a conversion, the engagment times, all this data is available within the main report.
Click on an event will give you all the details about the current hit payload, including event the internal data used by firebase in addition to the event name, event parameters and user properties.
iOS/Android platforms has been synched and the data is reported with the name key names, making even easier to do a cross-platform audits.
Lastly you'll be able to copy the events details to the clipboard within a single click.

Universal Analytics ( GA3 )
I know, this is legacy stuff, and we'll should have moved already to Firebase, but that's not always the case, so we're keeping this for these who still need to keep an eye on their Universal Analytics implementations.
This report will show the hits coming from the device to any Universal Analytics Properties in a friendly way, allowing you to copy these hits to the clipboard.

Google Tag Manager ( only Android )
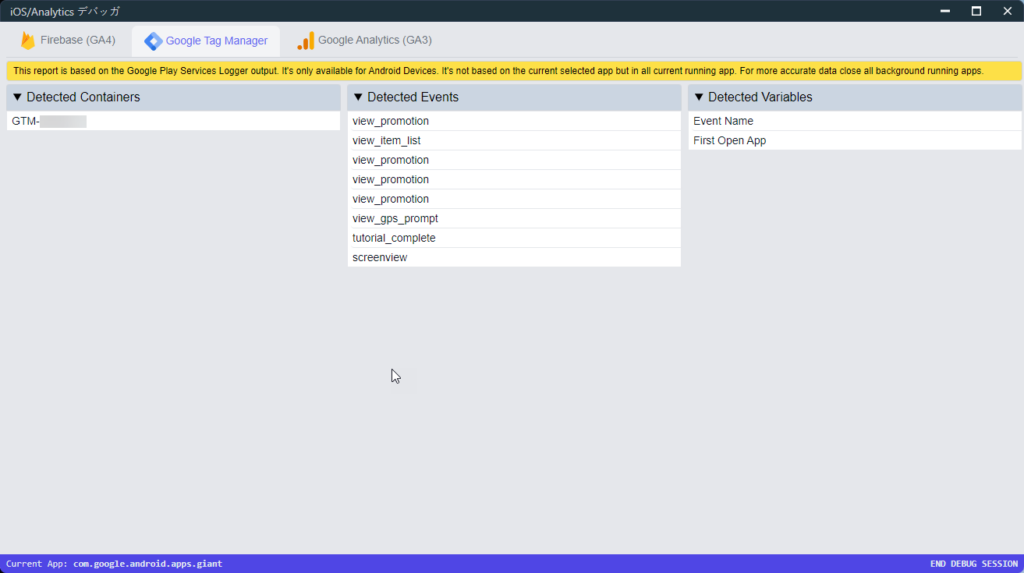
This report will show you the current containers, events, and variables being evaluated on your device, since this report relies on the Google Play Services logging service it only works for Android devices.
While it's not a full report, it may give you an overall idea of what is happening on Google Tag Manager on your device.

Adobe Analytics ( only for iOS )
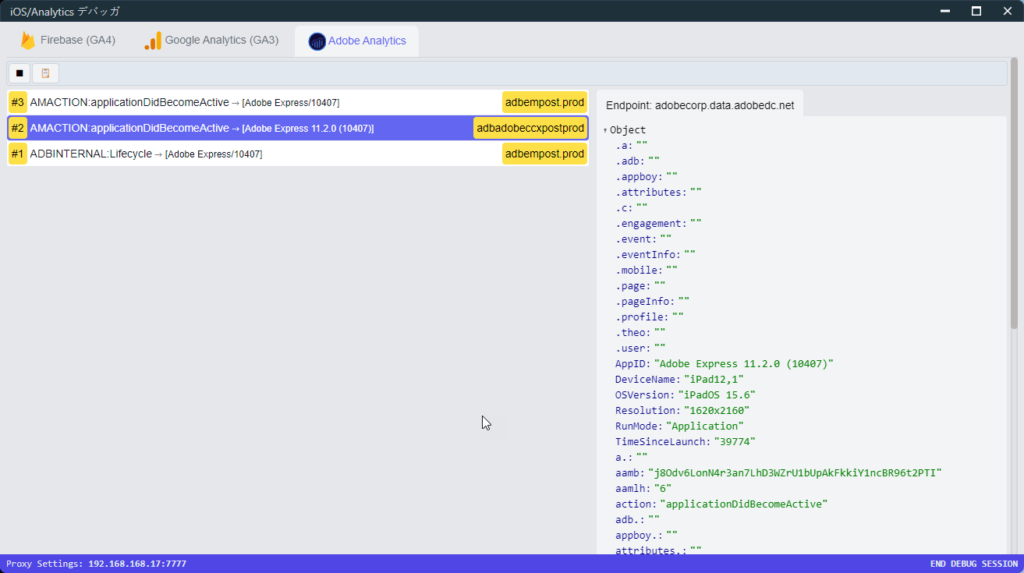
Since I was not able to offer GTM support, and I wanted to play around with some other tools, I've added support for debugging Adobe Analytics implementations.
This will reports the current Adobe Analytics hits being sent by your devices and will show all the detail in a friendly format. It will report the current event/page name, the current account, and the endpoint being used, along with full payload details.
As in the other tools, you'll be able to copy the hits information to your clipboard.

Splash Screen
I noticed that I was using a background image for the splash screen and since I was not able to find the author or if it had any copyright. I've asked my friend @kroniksan to make some AI generated backgrounds for me, and they look awesome.
If you are curious about them, you can check more AI generated deviations on his DeviantArt profile: https://www.deviantart.com/kroniksan
Download
https://www.analytics-debugger.com/tools/ios-android-debugger
