Today is a big day!, I finally managed to put some of my internal debugging snippets within a single Chrome Extension and I’ve just released it on the Chrome Webstore so everyone can try and use it.
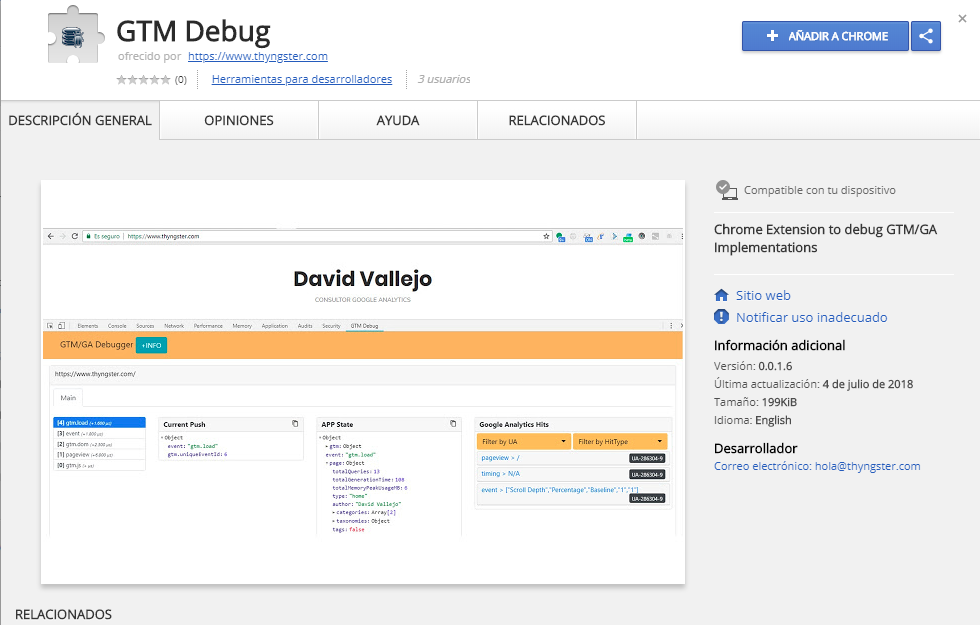
To install it you will need to visit the extension page on the Google Chrome Webstore, you can there just clicking on the screenshot below:
NOTE: The first time you open the extension panel. It may be show an empty report, just click F5 to start seeing data. This will be fixed on next release.
The extension focuses on debugging Google Tag Manager implementations ( most information reported is related to dataLayer information ), and it does also offer some information about Google Analytics hits being sent from the current loaded page ( ok folks: only Universal Analytics is supported, if you’re using the legacy GA library (ga.js) please give your implementation/client a bit of love and upgrade to Universal Analytics ).
The current extension release provides the following information:
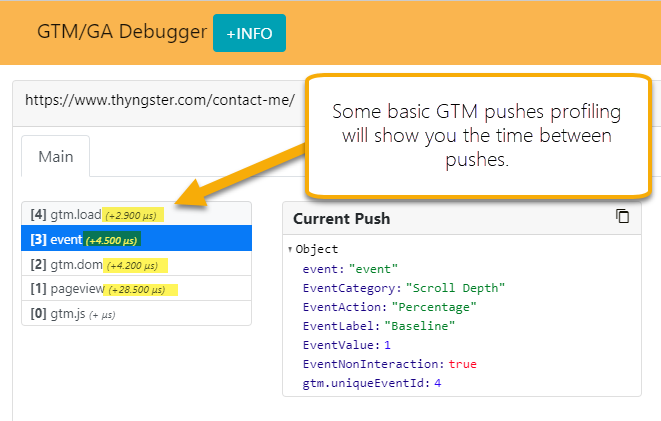
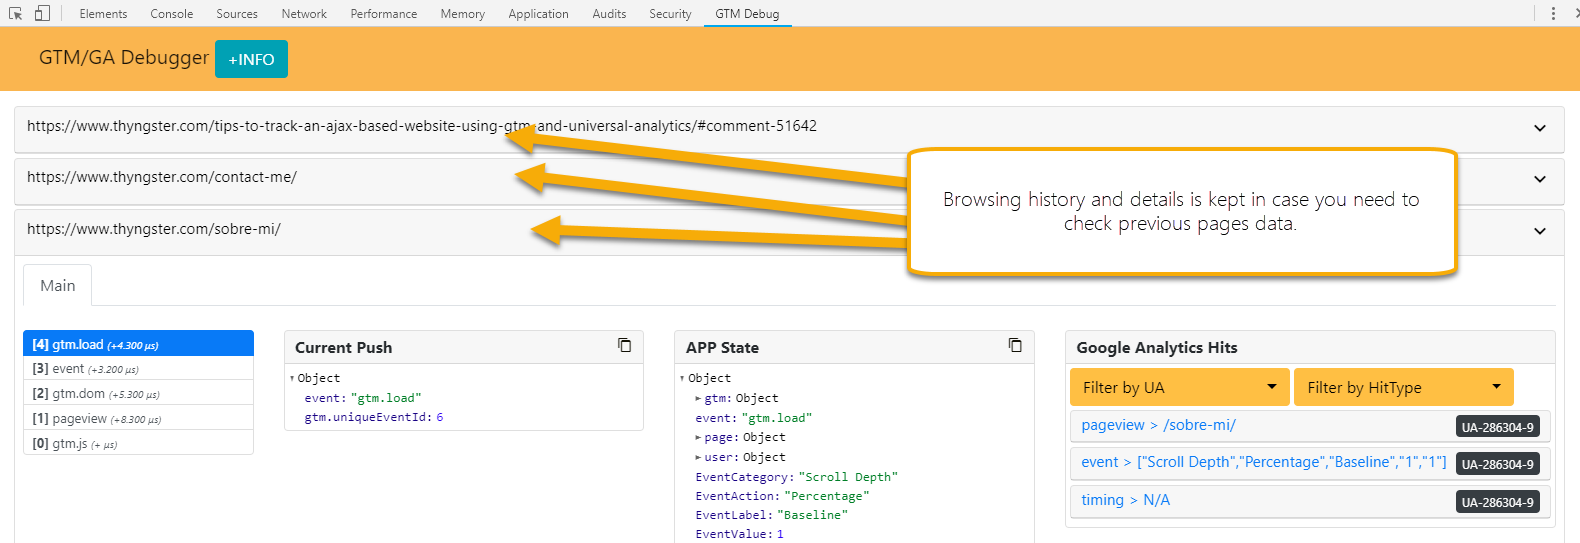
- dataLayer pushes list ( including some profiling details, like the time passed between pushes )
- Current push details and current dataLayer model status for each dataLayer push
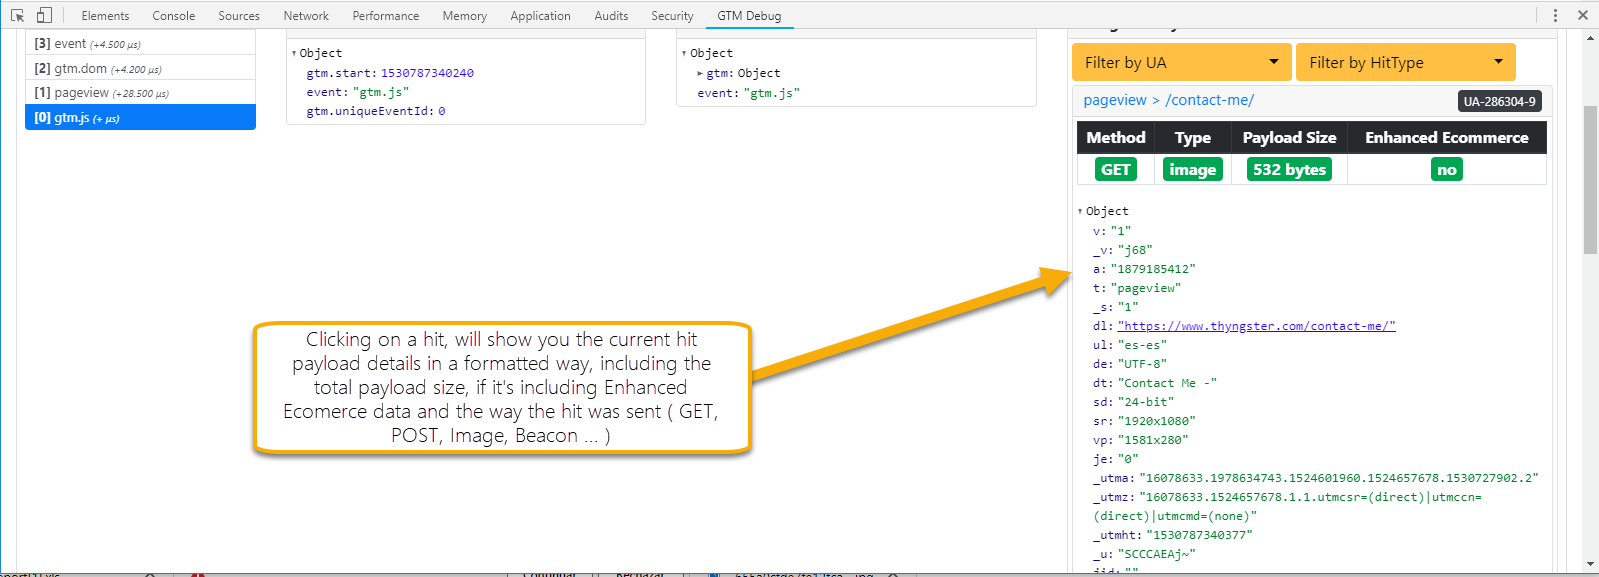
- Google Analytics hits sent by the current page.
Along with the pieces on info abouve the following features are available:
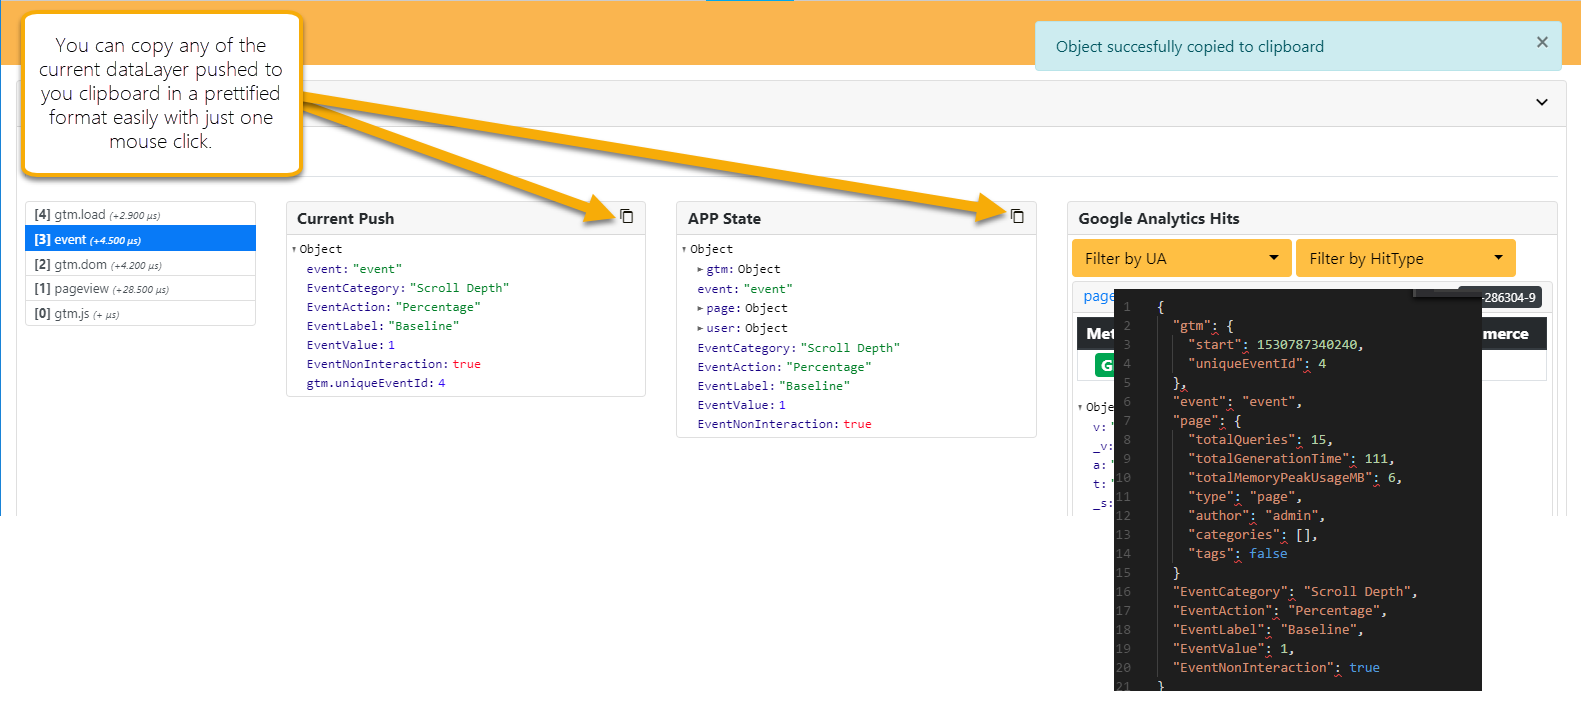
- All dataLayer pushes are shown in a prettified way, so they are more readable and easy to use.
- You can individually copy to the clipboard any push details in a formatted way ( useful for when making documentation for clients )
- Hits payload are shown in a prettied and formatted way, making the debugging even easier.
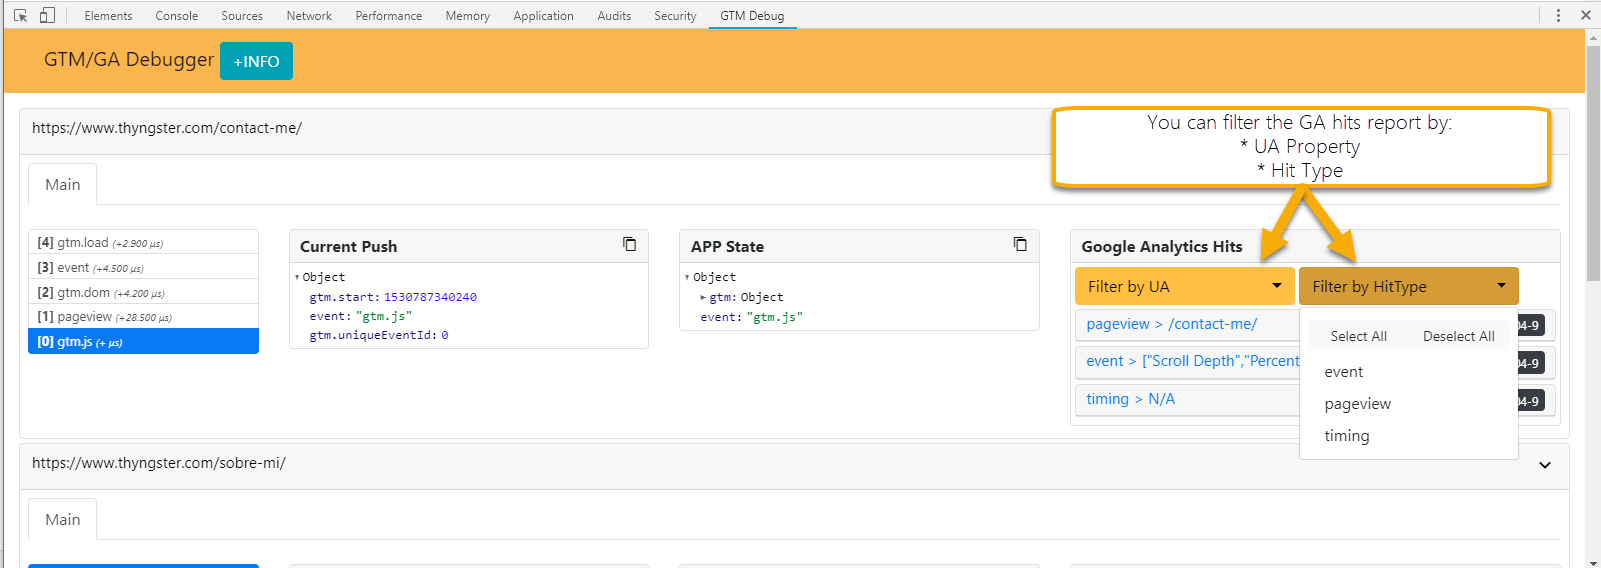
- You can filter the hits by the UA property ( great for when you’ve some big implementations sending hits to different properties )
- You can filter the hits by the type ( event, timing, pageview, etc )
- You can see the details about how each GA hit was sent, using GET, POST, or if it was sent using image or beacon transports
- You can easily view the current hit payload size and if it contains any Enhanced Ecommerce Data
The current GTM Debug Extension is somewhere between Alpha and Beta stages, so don’t be so hard with it. I’m already aware of it having some weird behaviour over some websites and it would be really helpful if you could take 5 minutes to report these bugs to me. I’ve opened a Google Group in order to be able to get feedback and bugs reports. You can find it on the following link: https://groups.google.com/forum/#!forum/gtm-debugger-extension
If you are working on a client website and want to expose the website, you can reach me through twitter or use this website’s contact form :).
Looking forward for your comments in order to improve the extension! 🙂
Install Extension: https://chrome.google.com/webstore/detail/gtm-debug/ilnpmccnfdjdjjikgkefkcegefikecdc
Extension Screenshots