
Analytics Debugger 2.0.0 Chrome Extension Release
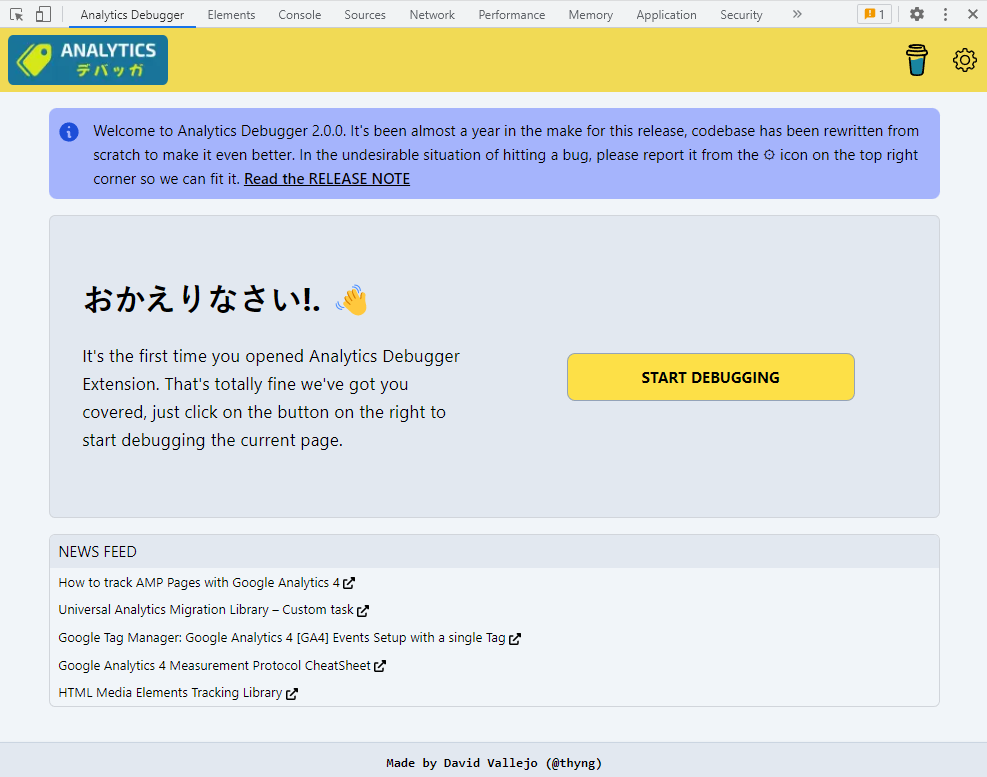
It took almost 9 months, but it's finally here. The new Analytics Debugger Extension (Formerly GTM/GA Debugger) hit the 2.0.0 milestone.
It's been a full rewrite of the code, mainly to make it fully compliance with the new MV3, but at the same time it's internal functionality has been improved. Now all the components are loaded asyncronouly, making the extension to use less resources and working fast, and it also make much more easier to add new features.
The UI has been kept faithful to the original one, but there're a lot of slight differences that make the reports more clean :). The report that has got the most changes ir the Google Analytics 4 one.

While debugging your Google Analytics 4 hits/events, you will be able to:
See the hit event batches
The server-side generated events (session_start, first_visit, etc )
On the main report you'll see the curretn event engagement time, if it's counting as a conversion, if it has ecommerce.
- See the events batches grouped but the holding hit request
- The server-side generated events (session_start, first_visit, etc )
- On the main report you'll see the curretn event engagement time, if it's counting as a conversion, if it has ecommerce.
- The current used endpoint
- If it's a sent to a SGTM server
- The SGTM response and header ( pixels, and cookies set server side )
- All the data is presented on a friendly way ( not only the parameters keys )
- Still you can see the raw payload details
- The current hit consent mode
- The session Id and Sessions coount
- If Google Signals is being used.
- You can filter the events by the Measurement ID or the event name
- Event parameters and User properties
And some much more new features coming in the future stay tuned.
Real Time Notifications

The new version, is able to show real-time news/notifications about the current viewed vendor. This will alow me to notify users about service outages or breaking changes on the tools. Of course all this is not automated and I'll need to be up to date with the news in order to have them showing up on time.
Amplitude Support
Another big news, it now supports Amplitude. It support seeing the current hit batches , as usual in a really friendly manner. Clicking the project ID will show up the current tracker/project configuration

Matomo/Piwik Support
I also added support for Matomo/Piwik. This report will allow you to see the hits coming in real time, it support the pings, link cliks, purchases. And you can even parse the current hits payload to exactly now what does each payload key means.

IU Updates
I really took some time to make the tool configurable, just because not everyone has the same needs. Now you can define which tools to show in your debugging session, and in which order you want the tabs to be shown on the reports:

The internalization has finally arrived, the extension is now available in English , Spanish and Japanese (kind). Which some more languages coming in the future.
You can choose if the hit payloads are shown in the way they are send or if you want the payload key sorted out alphabetically
You can choose the current deep level you want the object to be opened, some people just want the first level to be opened by default, other want to see a deeper level
Finally you may like to see more data in your screen, or you may use a 4K monitor that makes all very small, you can know setup the zoom level to make your debugging sessions more confortable.

Support / Bug Reports / Features Proposals
I've opened a Github repository, to track the bugs, you can find it here:
https://github.com/analytics-debugger/analytics-debugger-browser-extension/issues/new?assignees=thyngster&labels=bug&template=bug_report.md&title=
Final thoughts
Please have in mind I rewrite it from scratch, so while I feel it's more accurate that the previous version, some people may hit bugs on some sites. Just reach me so I can work on them.
Some more vendors are coming in the next months, just to mention some of them
- Adobe Analytics
- Adobe Launch
- Adobe Target
- Tealium IQ
- Yandex Metrika
- Chartbeat
And some more debugging features are also coming that will make some of the most complicated debugging tasks a breeze.